
Math Lesson: Effects of Exercise
Students get an opportunity to understand ratios, fractions, and percentages in the context of data on exercise effects. They get to explore how exercise affects the body, and they study the percentage of people across weight categories. They also generate their own dot plots to study the middle 50% of the distribution, helping them understand what is typical for the group.
Lesson Walkthrough
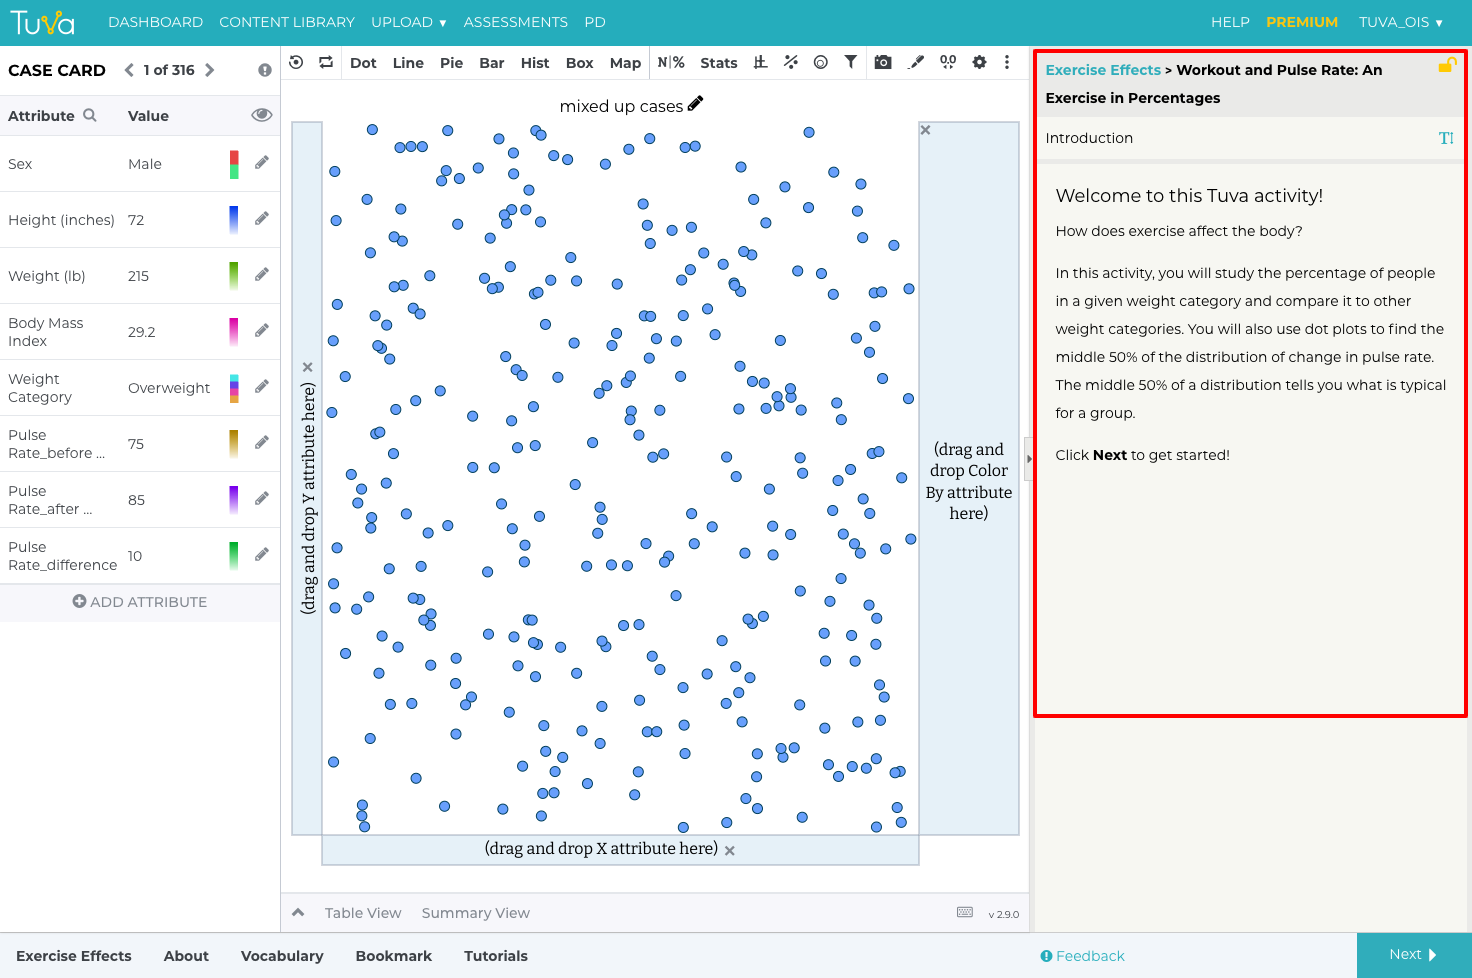
Getting started with the activity...
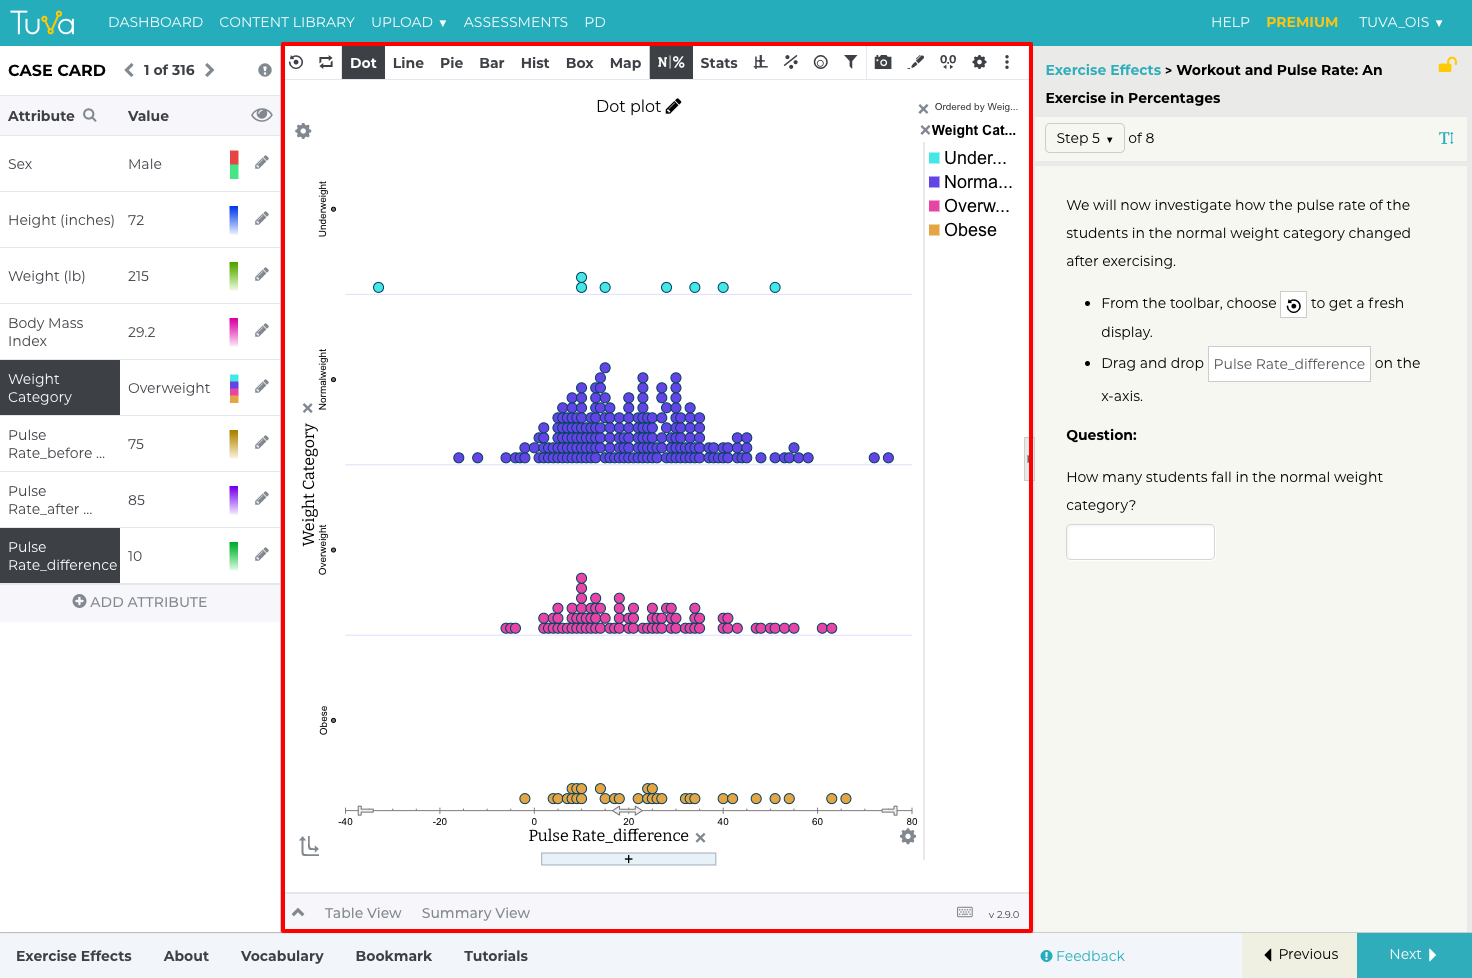
Creating dot plots to explore how the pulse rate before and after exercise varies by weight category
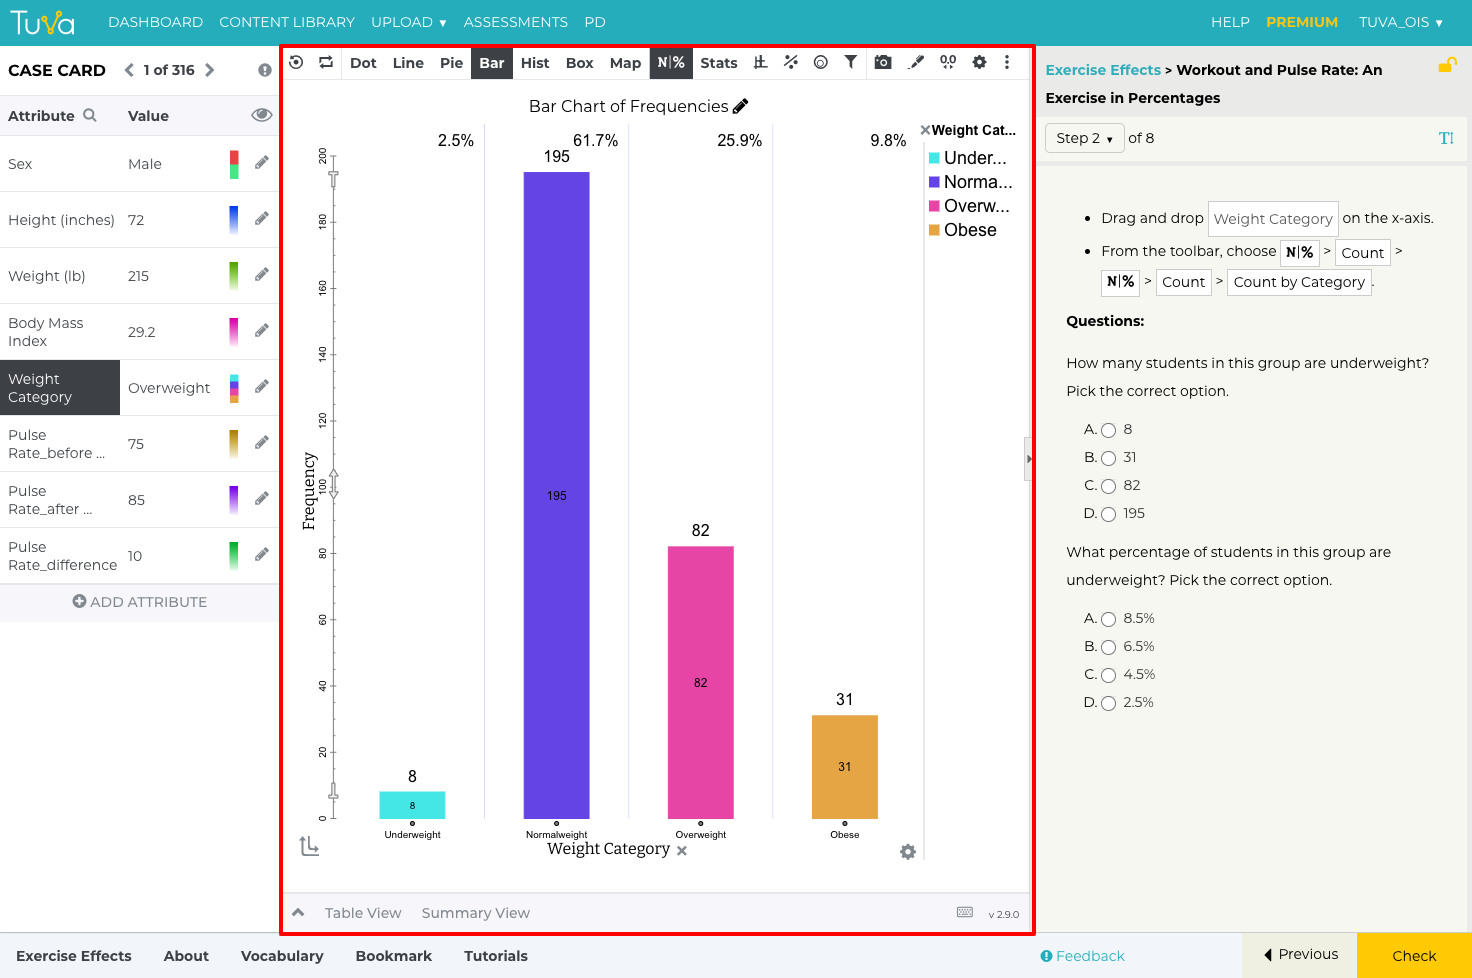
Creating frequency bar charts to further analyze the data
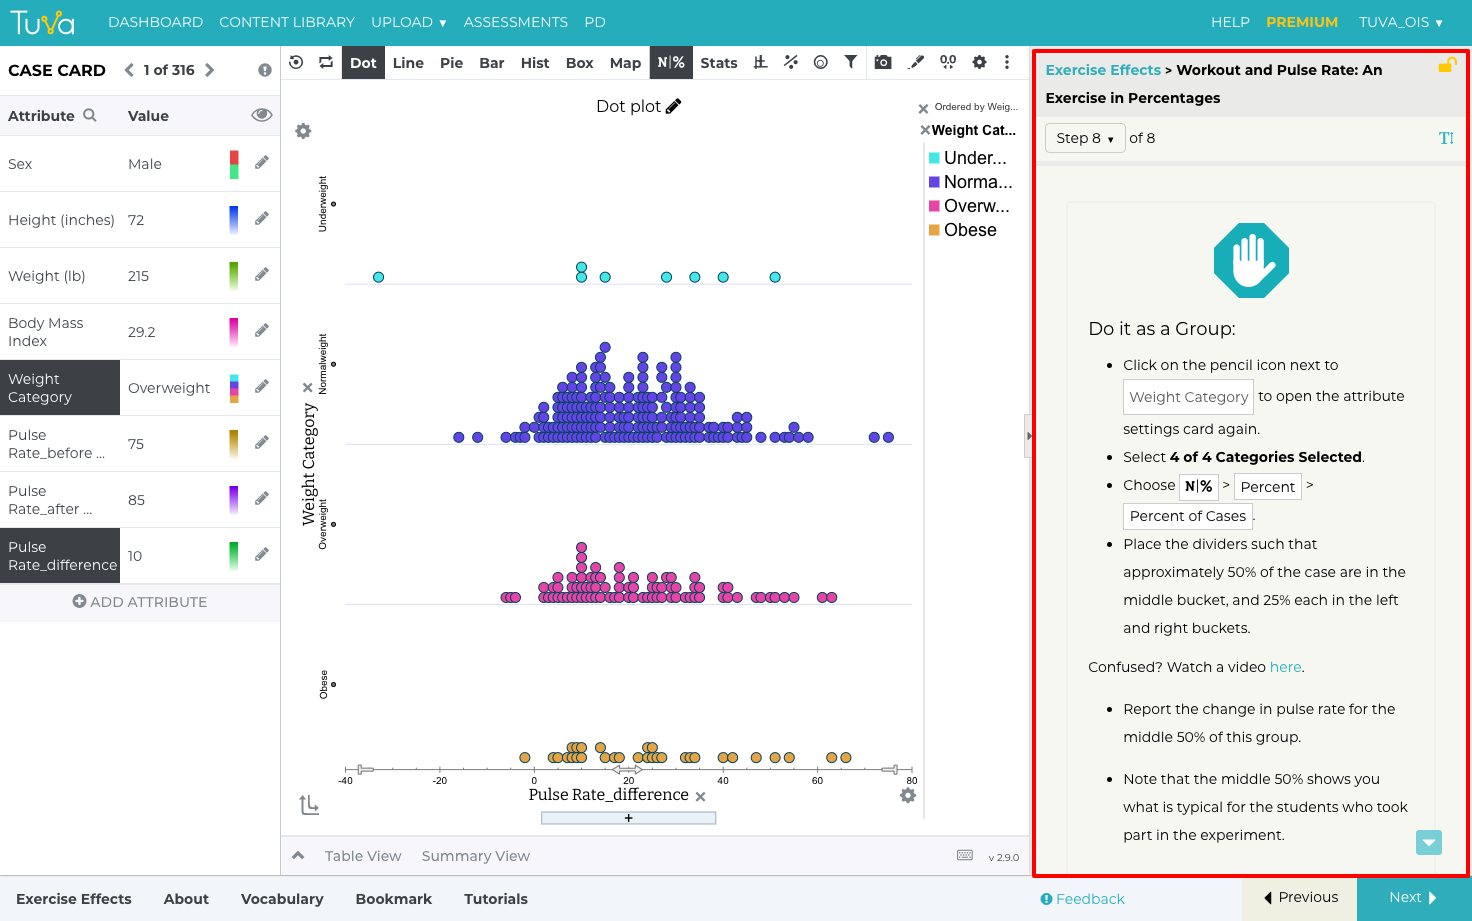
Discuss as a group what the middle 50% of the data for each weight category signifies....
Explore the Dataset
Experience this LIVE!
Liked the lesson? The experience is even better with a trained facilitator. Book an info session with the head of school and try a live lesson.