
Math Lesson - Revolutions & Distance
In a typical math class, students learn the symbols and formulas presented in their textbook without actually understanding what they represent, and how they can be used to solve a real-world problem or task. In this lesson, students work with experimental data to plot, model, and understand the relationship between the number of revolutions and the total distance covered by a cylindrical object. They interpret the slope as the circumference of the object being rolled, and learn how to account for the presence of an intercept even though the relationship is proportional.
Lesson Walkthrough
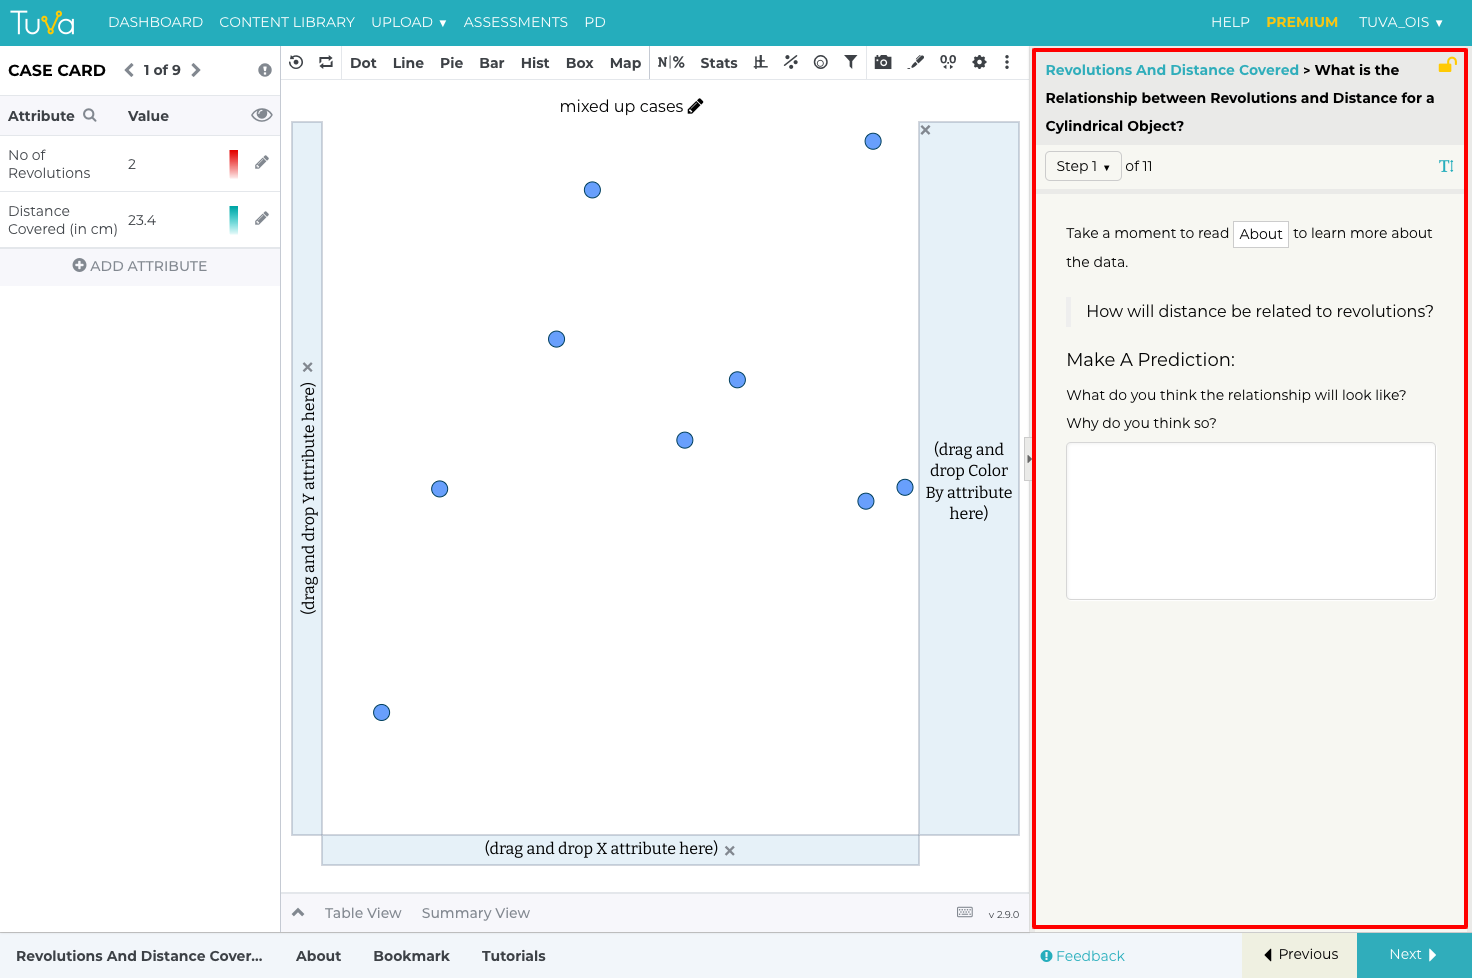
Start the activity by making a prediction...
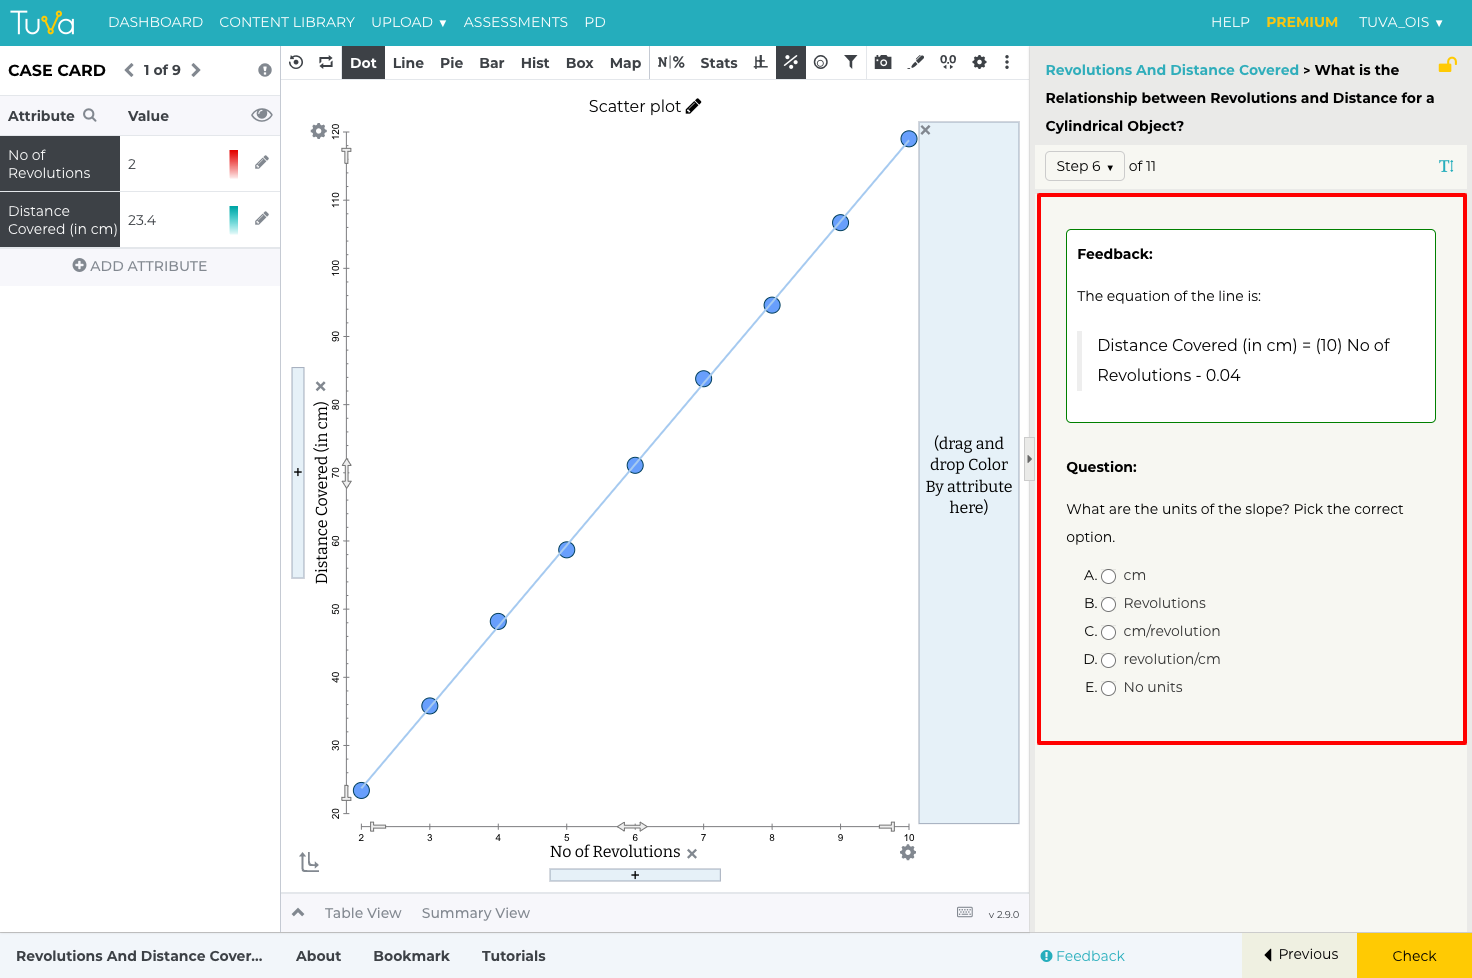
Create a scatter plot and then build a linear model of the relationship between the number of revolutions and distance covered
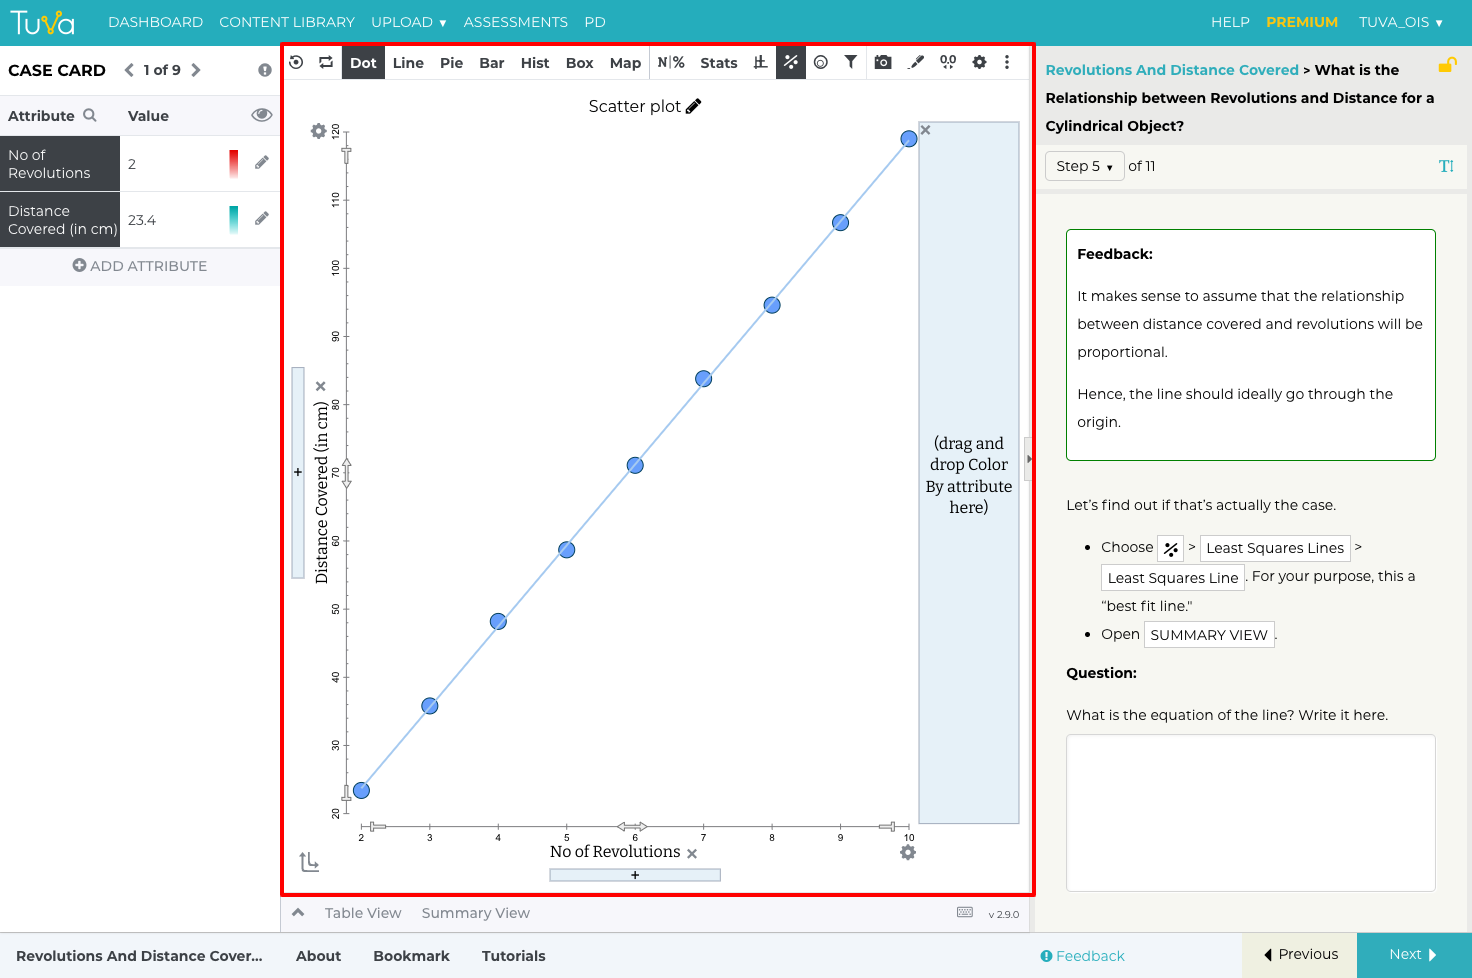
Make an assumption that the relationship is proportional, and then explore why the line does not go through the origin.
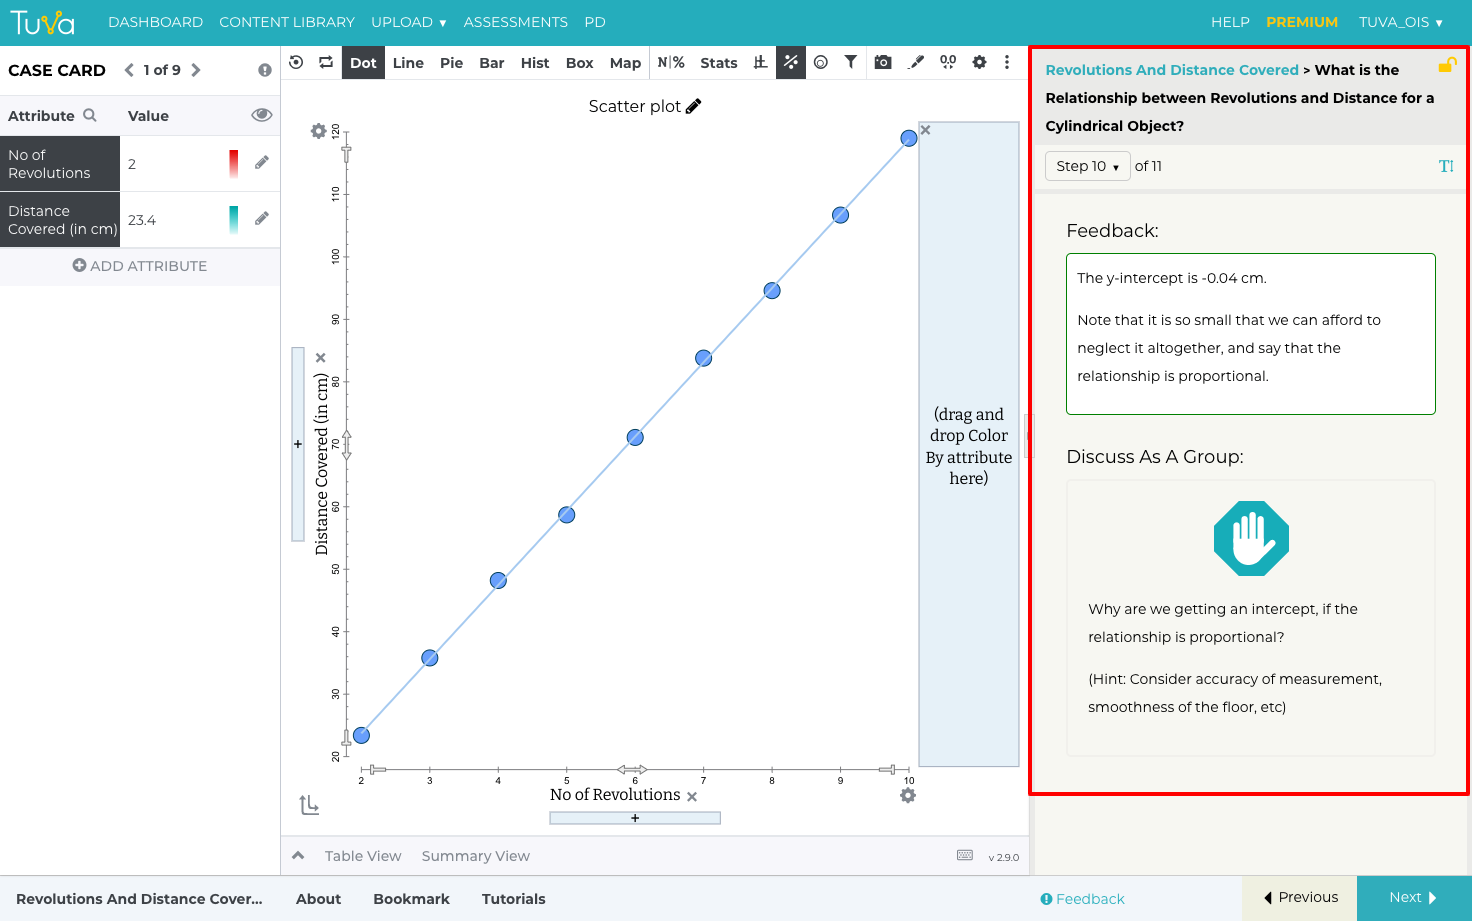
Discuss as a group why there is a y-intercept in our model, even though the relationship is proportional.
Explore the Dataset
Experience this LIVE!
Liked the lesson? The experience is even better with a trained facilitator. Book an info session with the head of school and try a live lesson.